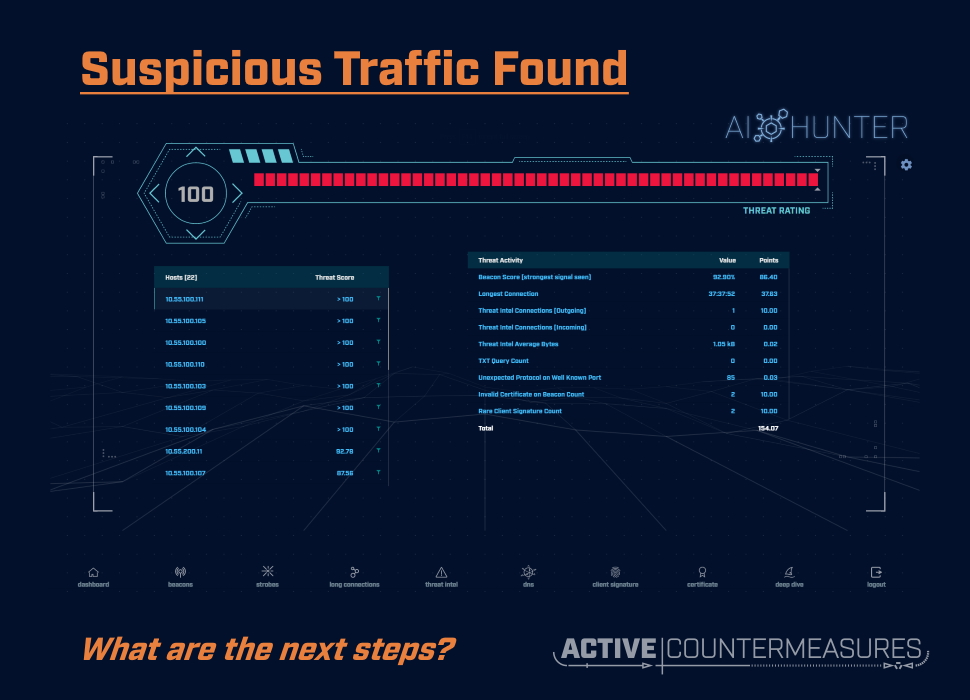
Suspicious Traffic Found – What Are the Next Steps?
Intro
Working with RITA or AI-Hunter to identify suspicious systems or traffic types is the first half of the battle. The second part is the investigation; following up with the systems at each end and the raw traffic they’re exchanging to decide whether the traffic in question is of concern or not.
The sections below are organized by the type of alert from AI-Hunter, and suggest steps you can take (along with tools to perform them) to dig down further into suspicious traffic.
General Approach
Tracking Incidents
Whatever tool you use for tracking incidents, we encourage you to record at least the following fields/data from any AI-Hunter traffic of interest:
- Source IP
- Destination IP and/or domain name. Bro records all dns lookups in its dns…log:
zcat dns.10\:00\:00-11\:00\:00.log.gz | bro-cut query qtype_name rcode_name answers | egrep '[[:space:]](A|AAAA|CNAME)[[:space:]]' | less


www.activecountermeasures.com  A    NOERROR 104.26.4.190,104.26.5.190
www.activecountermeasures.com  AAAA NOERROR 2606:4700:20::681a:4be,2606:4700:20::681a:5be
clientservices.googleapis.com  A    NOERROR 172.217.9.227
clientservices.googleapis.com  AAAA NOERROR 2607:f8b0:4006:819::2003
...
This lets you see what the client looked up (as opposed to the hostname associated with the IP address, which may not be the same as the names clients lookup or may not even exist.
- ASN. You should look up the name associated with that netblock by looking up the IP address at one of the following:
https://apility.io/search/ip.add.re.ss
https://ipinfo.io/
Both of these services will show you the name of the network block (called an ASN, or Autonomous System Number), which is far likelier to be accurate than the hostname.
- Protocol and port for TCP and UDP
- Traffic type (DNS, NTP, HTTPS, etc)
- For systems you own, get the system details recovered from a network scan or system inventory tool. In a pinch, gratr ( http://www.stearns.org/gratr/gratr ) can be run on the system or over ssh to extract basic system details. If you don’t have command line access, Nmap can give a start to system details with a command like:
nmap -O -sV --version-light --top-ports 10 -oG ip.add.re.ss
(Don’t use this type of scan on external systems – you could alert an attacker that you’re investigating them.)
System Forensics
In many cases you’ll be inspecting a local system for information about the process that is communicating with the outside world. On Linux systems and Macs (possibly augmented with Macports or Homebrew) you have command line tools that will allow you to identify running processes (ps), opened files (lsof), listening ports (netstat and ss), live connections (netstat and ss) and recently closed connections (netstat and ss). System log files may include details about process startup, shutdown, and/or crashed. On Linux systems, you may be able to extract specific details about processes and the system in general by inspecting the /proc/ and /sys/ trees (used by many forensic tools to gather their raw data). On Windows system you can find similar tools with Powershell and Sysmon.
Packet Capture
When you identify one or more systems of interest or ports that look suspicious it may be helpful to start capturing traffic that matches that criteria. Your Bro/Zeek sensor system is perfect for this; it already has access to the packets on your network and can handle saving the raw packets at the same time it’s analyzing them with Bro or Zeek.
To do this, log in to the Bro/Zeek sensor and run the following:
mkdir -p pcaps
sudo tcpdump -i eth0 -G 3600 -w 'pcaps/'`hostname -s`'.%Y%m%d%H%M%S.pcap' -z bzip2 'host 1.2.3.4 and tcp port 8000'
The “-i eth0” specifies the interface on which to grab packets – this is the one connected to your span/tap/mirror/copy port. -G 3600 says to write packets for an hour, and then close the pcap file and start writing to a new one. “-w…” writes the packets out to a file in the pcap directory named after the hostname of this system and the YYYYMMDDHHMMSS timestamp when this capture file was created. “-z bzip2” compresses the previous hour’s pcap file in the background while tcpdump is capturing new packets in a new file (this is automatically “nice”‘d so it doesn’t interfere with the packet capture).
The last part of the command in single quotes (‘host 1.2.3.4 and tcp port 8000’ in the above example) allows you to only capture traffic going to and from a specific host, that uses a specific port, or both (the “1.2.3.4” IP address could be a local system that appears to be beaconing out, a remote system running a command and control server, or some other IP address of interest). This expression is called a BPF, or Berkeley Packet Filter. The vast majority of tools that can capture or process packets allow you to specify a BPF to cut down the amount of data to be captured or processed. If you don’t specify a BPF the tool with work with all packets, regardless of host IP or port – great for having a full view of all traffic, though this uses a lot of processor time, disk bandwidth, and disk capacity.
Now you have pcap files that can be analyzed and re-analyzed with any pcap tool you’d like, including Bro/Zeek (and therefore RITA and AI-Hunter), tcpdump, dnstop, ngrep, wireshark/tshark, and many others (http://www.stearns.org/doc/pcap-apps.html).
Forensic Steps
High Confidence Beacons
Potential Reasons for These to Exist
- NTP. If the port involved is “123:udp:ntp” (or occasionally “123:udp:-“) and the host is one that your machines use for syncing time (“ntp.mycompany.com” or “ntp.myisp.com”, for example), this is likely NTP traffic and likely benign. You may wish to whitelist this particular NTP host as a destination.
- Network monitoring tools. These can regularly connect to systems (generally public servers) and check that the service is accepting connections, responding to requests, and not overloaded). Because these happen at regular intervals, they look exactly like beacons.
- Other scheduled tasks that transfer data between systems.
- Command and Control (C2) traffic.
How to Investigate
- Identify the expected use of the internal IP address; is it a server, laptop, tablet, cell phone, or IoT device? What operating system does it run?
- Is the type of traffic you’re seeing consistent with that particular operating system? If it’s not clear, compare the running applications and network traffic against a similar system. If this system is running some applications that similar systems aren’t start your search with those.
- Look at the external IP address; is it 1) part of your organization’s IP range, 2) owned by a partner, 3) a router or gateway, 4) at a cloud provider, or 5) none of the above? Should the two be having any kinds of conversations at all?
- Does the external IP show up in AbuseIPDB or apility.io? Does your internal ticketing system show any events with this IP in the past? Does Deep Dive show it holding conversations with any other internal systems?
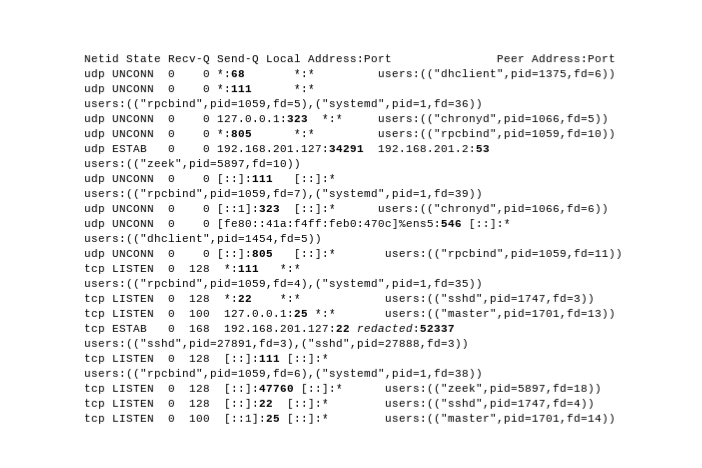
- Take a look at the internal system. Can you identify what process holds conversations with the external system? To see the open ports on a Linux system, try “ss” (port numbers are in bold):
$ sudo ss -tuanp | cat
If your system does not have “ss” installed, try:
sudo netstat -anp | grep '^..p'
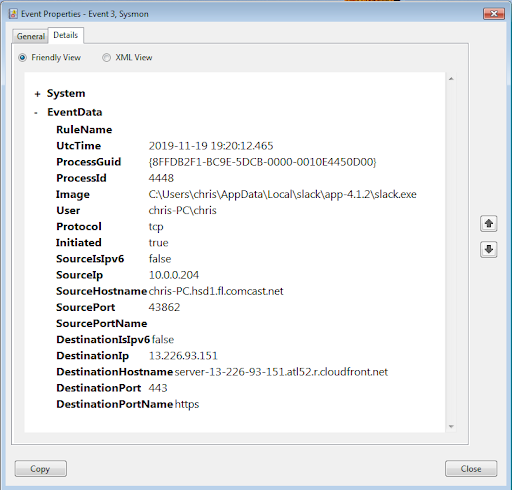
- On Windows systems, you can use Sysmon – specifically Event ID 3 – to find open connections. Here’s an example of an outbound connection:
- Do you see unusual processes on the system?:
ps axf
shows the currently running processes in a “tree” view, where each process shows up under the parent process that started it. This makes it easier to identify groups of processes. As a general rule, processes whose names are in square brackets and low-numbered are kernel modules, and less likely to be malicious.
Strobes
Potential Reasons for These to Exist
By their nature, these are conversations that happen tens of thousands of times a day or more. Ironically, most C&C communications don’t happen that frequently; the attacker doesn’t want to alert a network administrator with that volume of traffic. These are more likely to be high-speed legitimate processes.
How to Investigate
The steps for investigation are the same as for “High Confidence Beacons”, above.
Finishing up With a Strobe
One thing to note is that strobes consume a lot of memory and processing power in a Bro/RITA/AI-Hunter environment. Once you’ve identified one or more of them as benign, you can certainly whitelist as with any other type of traffic, but you may also want to consider not processing them in the first place. Here’s how the two approaches compare:
Stop Processing Strobes With a Filter
Pro: you no longer devote memory, processor time, or disk space in Bro, RITA, or AI-Hunter to handle the strobe traffic.
Con: The strobe traffic is unconditionally removed from the stream of packets heading to Bro/Zeek, and is not processed at all. The only way to see the strobe traffic again is to remove the filter and wait 24 hours for fresh data to make it through the system.
Whitelisting
Pro: A whitelist entry can be added and removed at any time, so if you want to make the strobe traffic visible again you just remove the associated whitelist entry.
Con: While you no longer see the traffic in AI-Hunter, the processing of them is still done in Bro/Zeek and RITA, along with the memory and disk usage for them.
To implement a filter, perform the following steps on (each of) your Bro/Zeek sensor(s):
– Log in and edit broctl.cfg with (substituting your favorite editor):
sudo vi /opt/bro/etc/broctl.cfg
or
sudo vi /opt/zeek/etc/zeekctl.cfg
– If there’s no “BroArgs = …” line, add one like the following, changing the hosts and port to match the traffic you no longer wish to see:
BroArgs = -f 'not (host 1.2.3.4 and host 6.7.8.9 and udp port 2222)'
– If you wish to whitelist an entire subnet at one or both ends instead of single hosts, replace “host 10.0.12.55” with “net 10.0.12.0/24” as an example.
– If you already have a BroArgs line, you’ll have to merge your new filter with the existing filter; contact us for help.
– Once your new filter is in place, run:
sudo broctl deploy
or
sudo zeekctl deploy
to check the configuration, push out the new configuration files, and restart Bro/Zeek.
Long Connections
Potential Reasons for These to Exist
- VPN or other tunnel
- Long-term connection between SQL servers for replication
- SSH connection
- BGP connection between routers
- Long download
- Remote desktop session
- C2
How to Investigate
Run these on the Bro/Zeek instance.
To see the connection details about this traffic:
zcat /opt/bro/logs/20*/conn.*.log.gz | less
zcat /opt/bro/logs/`date +%Y-%m-%d`/conn.*.log.gz | grep 'internal_ip' | grep 'port_used' | less
The bro-cut tool cleans up the output dramatically by only showing the fields you’re interested in:
cd /opt/bro/logs/2019-12-16
zcat conn.14\:00\:00-15\:00\:00.log.gz | bro-cut id.orig_h id.resp_h id.resp_p proto service

10.0.0.215 10.0.0.1 53 udp dns
10.0.0.215 10.0.0.1 53 udp dns
10.0.0.215 10.0.0.1 53 udp dns
10.0.0.41 224.0.0.251 5353 udp dns
10.0.0.179 224.0.0.251 5353 udp dns
10.0.0.41 131.186.113.70 80 tcp http
...
If you’re specifically interested in one IP, port number, or service, you can use grep at the end of this command to just see those:
cd /opt/bro/logs/2019-12-16
zcat conn.14\:00\:00-15\:00\:00.log.gz | bro-cut id.orig_h id.resp_h id.resp_p proto service | grep 'dns'

10.0.0.215 10.0.0.1 53 udp dns
10.0.0.215 10.0.0.1 53 udp dns
10.0.0.215 10.0.0.1 53 udp dns
10.0.0.41 224.0.0.251 5353 udp dns
10.0.0.179 224.0.0.251 5353 udp dns
...
To see the raw packets that make up the connections:
tcpdump -r packet_capture.pcap -tnp 'host internal_ip and host external_ip and port port_used'
tcpdump -i eth0 -tnp 'host internal_ip and host external_ip and port port_used'
To see a more verbose display of these packets and use the analysis features of tshark:
tshark -r packet_capture.pcap ip.src.ip==internal_ip and ip.dest==external_ip and udp.dstport==port_used
tshark -r packet_capture.pcap ip.src.ip==internal_ip and ip.dest==external_ip and tcp.dstport==port_used
Also, any pcaps can be loaded into wireshark (available for Windows, Mac, and Linux).
Two more blogs on analysis with tshark:
https://activecm.github.io/threat-hunting-labs/dns/#tshark
https://www.activecountermeasures.com/blog-tshark-examples-for-extracting-ip-fields/
Host Listed Under Threat Intel
Potential Reasons for These to Exist
- Server is currently hosting malware or other objectionable content, or is sending spam
- Server was doing one of those, but the person responsible has stopped using that IP address/hostname to do so, and is doing it from another system; the first system may still be listed as sketchy long after it stopped. This is especially common at cloud providers where an IP address can be repurposed in just a few minutes.
- Server is at a hosting company, cloud provider, or just a normal machine connected via an ISP and isn’t doing anything wrong at all. The group managing blocks of addresses like these may proactively submit their address ranges to blacklist maintainers, asking them to be tagged as residential, cloud, dynamic or something else that shouldn’t be hosting servers.
- Other incorrect classification as bad.
How to Investigate
Enter the domain name or IP address in question at one of the following (meta) lookup tools:
https://www.ultratools.com/tools/spamDBLookup
https://mxtoolbox.com/blacklists.aspx
https://w3dt.net/tools/dnsbl
https://www.abuseipdb.com/
https://apility.io/
https://megritools.com/blacklist-lookup
If the domain/IP is listed, you’ll receive more details on why.
High Numbers of DNS Entries
Potential Reasons for These to Exist
- Massive domain; there are a few domains like amazonaws.com, akamaiedge.com, and akadns.net that have thousands of legitimate hosts, and it’s possible you might see them at the top of your list. Even these domains are very unlikely to show up with more than 300-400 actual lookups, though.
- Anything with more than 1000 actual lookups deserves close inspection; this is highly unlikely to be legitimate. In the cases where it is legitimate (perhaps a piece of software that generates random “hostnames” to track web activity), you can whitelist these once you’ve found them.
How to Investigate
Run these on the Bro/Zeek instance.
To see the connection details about this traffic:
zcat /opt/bro/logs/20*/dns.*.log.gz | less
zcat /opt/bro/logs/`date +%Y-%m-%d`/dns.*.log.gz | grep 'internal_ip' | less
To see the raw packets that make up the connections:
tcpdump -r packet_capture.pcap -tnp 'host internal_ip and host external_ip and port 53'
tcpdump -i eth0 -tnp 'host internal_ip and host external_ip and port 53'
To see a more verbose display of these packets and use the analysis features of tshark:
tshark -r packet_capture.pcap ip.src.ip==internal_ip and ip.dest==external_ip and udp.dstport==53
tshark -r packet_capture.pcap ip.src.ip==internal_ip and ip.dest==external_ip and tcp.dstport==53
If you have access to a pcap file or live stream of these requests, consider running dnstop (http://dns.measurement-factory.com/tools/dnstop/ ; sample output at http://dns.measurement-factory.com/tools/dnstop/sample.html). This provides statistics on dns queries, in particular the query source IP, the top and second-level domains being queried, and the query types.
Rare Client Signature
Potential Reasons for These to Exist
- Systems that have not been patched in a while (and are too old; similar devices are now on newer applications/libraries/OS).
- Systems that are getting beta patches (and are too new; similar devices are now on older, but current, applications/libraries/OS).
- One-off system doing monitoring or running custom/beta/development code.
- Malicious binary calling to C2.
- Web crawlers: If the systems you monitor include web servers that accept connections from the outside world, you will have tons of these because of web crawlers.
How to Investigate
- Do a Google search for that Client signature – see if you can identify if it’s associated with a particular tool, malware, or scanner.
- Search the local system for running processes or scripts that might use that Client signature.
- Inspect packets that have that Client signature with ngrep (Introduction to Ngrep):
ngrep -d en4 -t -O Nozilla999.pcap 'Nozilla999' 'tcp and port 80'
“-d en4” specifies the interface on which to listen (use “-I rawpackets.pcap” if you wish to read packets from a file). The -t shows packet timestamps. -O saves all matching packets into a pcap file in case you wish to reanalyze these later. The string in the middle is the Client signature we’re looking for. The final expression is the filter used to just inspect http traffic (and can be extended to include IP addresses with ‘and host ip.add.re.ss’). Ngrep will extract packets that both match this filter and contain the string in question, returning a single line header for each packet and the printable text from the payload:
$ ngrep -d en4 -t -O Nozilla999.pcap 'Nozilla999' 'tcp and port 80'
interface: en4 (10.0.0.0/255.255.255.0)
filter: (ip or ip6) and ( tcp and port 80 )
match: Nozilla999
output: Nozilla999.pcap
####

T 2019/11/04 12:41:18.320040 10.0.0.41:52334 -> 12.13.14.15:80 [AP]
GET / HTTP/1.1..User-Agent: Nozilla999..Accept: */*..Accept-Encoding: identity..Host: www.example.org..Connection: Keep-Alive....
####################################
(The “#” symbols are packets that match the filter but do not contain Nozilla999).
Keep in mind that many tools placing an HTTP request can substitute a different Client signature, often with nothing more than a command-line parameter:
wget --user-agent='Nozilla999' http://www.cnn.com
Ironically, doing this with a not-otherwise-used Client signature can fingerprint your tool.
Certificate Errors
While there are multiple types of problems with SSL/TLS certificates, one of the most common to show up in AI-Hunter is “Unable to get local issuer certificate”. The investigation process is similar no matter what the specific error.
Potential Reasons for These to Exist
- Web server run by your organization which does not have a signed certificate
- Vendor web server that does not have a signed certificate
- Expired certificate
- Certificate that’s no longer considered secure
How to Investigate
Zeek already does some analysis on the connection and the x509 certificate used in a TLS handshake. To see how to use the ssl.log and x509.log, see Corelight’s blog post
To have a web service do the scanning for you, try https://www.ssllabs.com/ssltest/ .
To run the test locally, run testssl ( https://testssl.sh/ , source at https://github.com/drwetter/testssl.sh). This runs on Windows (with WSL, MSYS2, or Cygwin), MacOS, and Linux with no additional libraries.
One advantage of choosing the local approach is that you can include these in regular network scan scripts or procedures to identify certificate issues.
Sample run:
$ mkdir testssl
$ cd testssl
$ git clone --depth 1 https://github.com/drwetter/testssl.sh.git
Cloning into 'testssl.sh'...
...
$ cd testssl.sh
$ ./testssl.sh www.whitehouse.gov

###########################################################
testssl.sh 3.0rc5 from https://testssl.sh/dev/

This program is free software. Distribution and
modification under GPLv2 permitted.
USAGE w/o ANY WARRANTY. USE IT AT YOUR OWN RISK!

Please file bugs @ https://testssl.sh/bugs/

###########################################################

Using "OpenSSL 1.0.2-chacha (1.0.2k-dev)" [~183 ciphers]
on laptop1:./testssl.sh/bin/openssl.Darwin.x86_64
(built: "Feb 22 09:55:43 2019", platform: "darwin64-x86_64-cc")

Start 2019-11-01 14:32:13 -->> 104.107.10.32:443 (www.whitehouse.gov) <<--

Further IP addresses: 2600:1401:4000:18e::fc4 2600:1401:4000:185::fc4
rDNS (104.107.10.32): a104-107-10-32.deploy.static.akamaitechnologies.com.
Service detected: HTTP

Testing protocols via sockets except NPN+ALPN

SSLv2 not offered (OK)
SSLv3 not offered (OK)
TLS 1 not offered
TLS 1.1 offered (deprecated)
TLS 1.2 offered (OK)
TLS 1.3 not offered and downgraded to a weaker protocol
NPN/SPDY h2, h2-14, http/1.1, http/1.0 (advertised)
ALPN/HTTP2 h2, http/1.1 (offered)

Testing cipher categories
...
The output goes on for a while, testing all kinds of SSL settings, vulnerabilities, and misconfigurations, noting whether a particular aspect is OK, deprecated, or VULNERABLE. I’d suggested redirecting the output to a file so you can review it now and compare it to future scans and see what’s changed:
$ ./testssl.sh www.whitehouse.gov | tee www.whitehouse.gov-`date +%Y%m%d%H%M%S`.scan
To get the raw details from a certificate, try:
echo | openssl s_client -connect "www.whitehouse.gov:443" -servername "www.whitehouse.gov" 2>/dev/null | openssl x509 -noout -text
Sample Output:
Certificate:
Data:
Version: 3 (0x2)
Serial Number:
0b:75:95:99:7c:6a:70:45:14:66:de:9a:bf:87:88:0d
Signature Algorithm: sha256WithRSAEncryption
Issuer: C = US, O = DigiCert Inc, CN = DigiCert SHA2 Secure Server CA
Validity
Not Before: Dec 24 00:00:00 2018 GMT
Not After : Mar 24 12:00:00 2020 GMT
Subject: C = US, ST = District Of Columbia, L = Washington, O = The Executive Office of the President, OU = Office of Administration, CN = *.whitehouse.gov
Subject Public Key Info:
Public Key Algorithm: rsaEncryption
...
Closing out the Item of Interest
Once you’ve done all the needed investigation, you’ve likely come up with a picture of whether the traffic was benign or malicious.
If it’s benign, you can remove it from future view by whitelisting it. AI-Hunter lets you whitelist traffic based on source IP, destination IP, or the pair of IPs. The latter is best when you have just a few systems at each end involved. You can certainly whitelist a particular Source IP or Destination IP, but keep in mind that you won’t see those systems at all, even if new traffic shows up on a different port. We discourage whitelisting an IP address or address block unless you are very confident that it’s/they’re unlikely to ever host anything malicious.
If the traffic turned out to malicious, banned by policy, or just plain unwanted, now you can look at how to better handle it on your network. A few options:
- Block the traffic using a network firewall, IPS, or router.
- Block the traffic using the built-in firewall in the local machine’s operating system. This is less preferred as it can be disabled with local machine access.
- Remove the offending software from the local system and set an alarm if it’s ever re-installed on the offending system or installed anywhere else.
- For traffic where you’d like to collect more information for forensic or legal reasons, don’t block it but instead continue packet capture.

Bill has authored numerous articles and tools for client use. He also serves as a content author and faculty member at the SANS Institute, teaching the Linux System Administration, Perimeter Protection, Securing Linux and Unix, and Intrusion Detection tracks. Bill’s background is in network and operating system security; he was the chief architect of one commercial and two open source firewalls and is an active contributor to multiple projects in the Linux development effort. Bill’s articles and tools can be found in online journals and at http://github.com/activecm/ and http://www.stearns.org.